You haven't signed in yet, you can have a better experience after signing in
*Please complete the payment within {{receiveCouponInfo.expire_at}}Previous use*
You haven't signed in yet, you can have a better experience after signing in
 Grapher 2D/3D data-driven XY scientific mapping and statistical analysis software
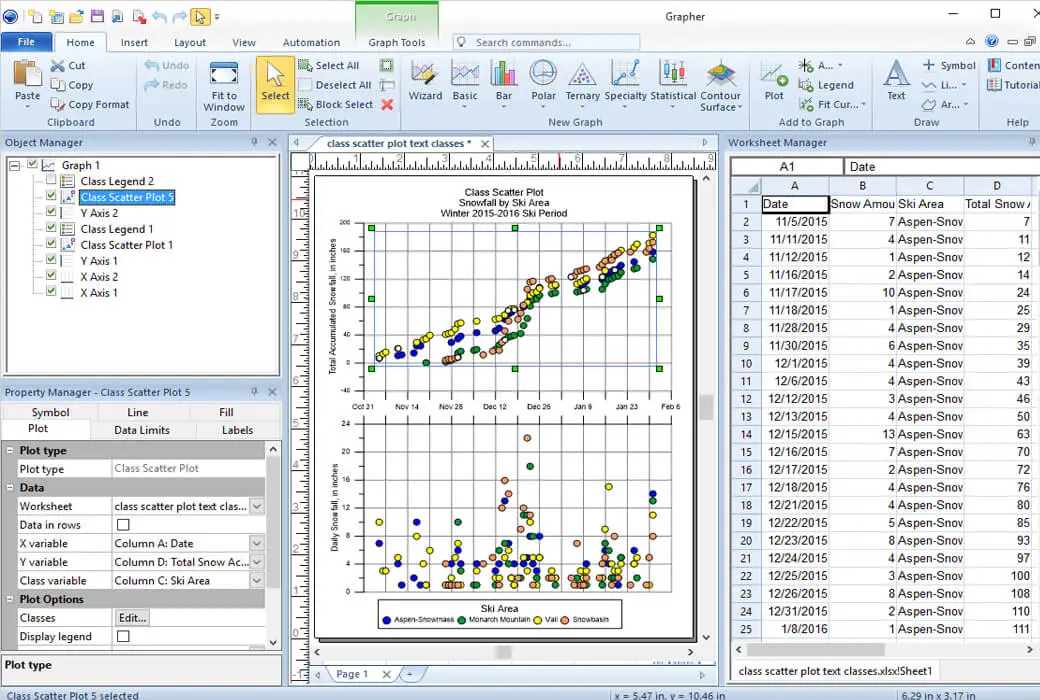
Activity Rules
1、Activity time:{{ info.groupon.start_at }} ~ {{ info.groupon.end_at }}。
1、Activity time:cease when sold out。
2、Validity period of the Group Buying:{{ info.groupon.expire_days * 24 }} hours。
3、Number of Group Buying:{{ info.groupon.need_count }}x。
Please Pay Attention
1、Teamwork process: Join/initiate a Group Buying and make a successful payment - Within the validity period, the number of team members meets the activity requirements - Group Buying succeeded!
2、If the number of participants cannot be met within the valid period, the group will fail, and the paid amount will be refunded in the original way.
3、The number of people required and the time of the event may vary among different products. Please pay attention to the rules of the event.
Grapher
Professional 2D and 3D drawing and statistical analysis software to gain a deep understanding of your data.
Easily visualize complex data
Understanding complex datasets can be a challenge. Grapher faces this challenge head-on and provides an intuitive platform for creating stunning graphical representations. With Grapher, you can simplify complex datasets, making them easy to access and understand.
Whether you are generating graphs for industry presentations, updating quarterly reports on customer retirement projects, or analyzing environmental impacts over time, Grapher can not only clearly convey complex information, but also help you complete your work accurately and elegantly.
Your expertise deserves the best service in visualization.
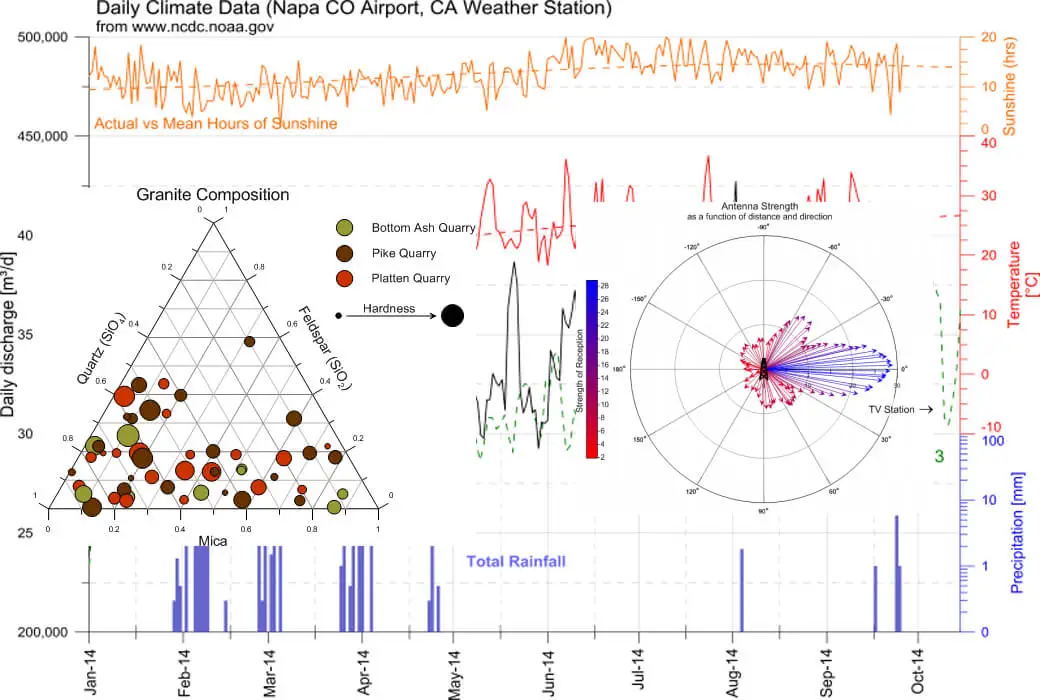
Dynamic visualization
Effortlessly convert raw data into over 70 common graphic types. From basic line and bar charts to complex 3D vectors and statistical graphs, Grapher can flexibly visualize data in any form you can imagine.
Fully compatible
Seamless visualization and analysis of data from multiple sources. Import file formats such as ACCDB, DBF, and XLSX, and export to popular formats such as PDF, TIF, and PNG.
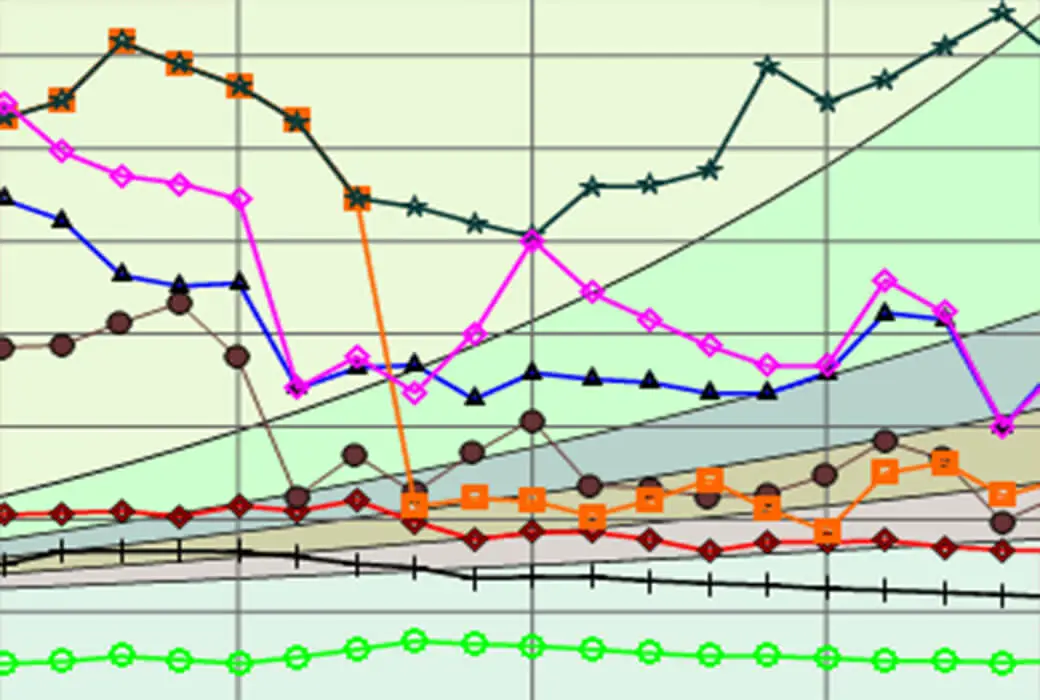
Influential speech
Creating visual effects that not only convey data but also tell stories. Utilize Grapher's extensive customization to create charts that attract audiences and highlight key insights.
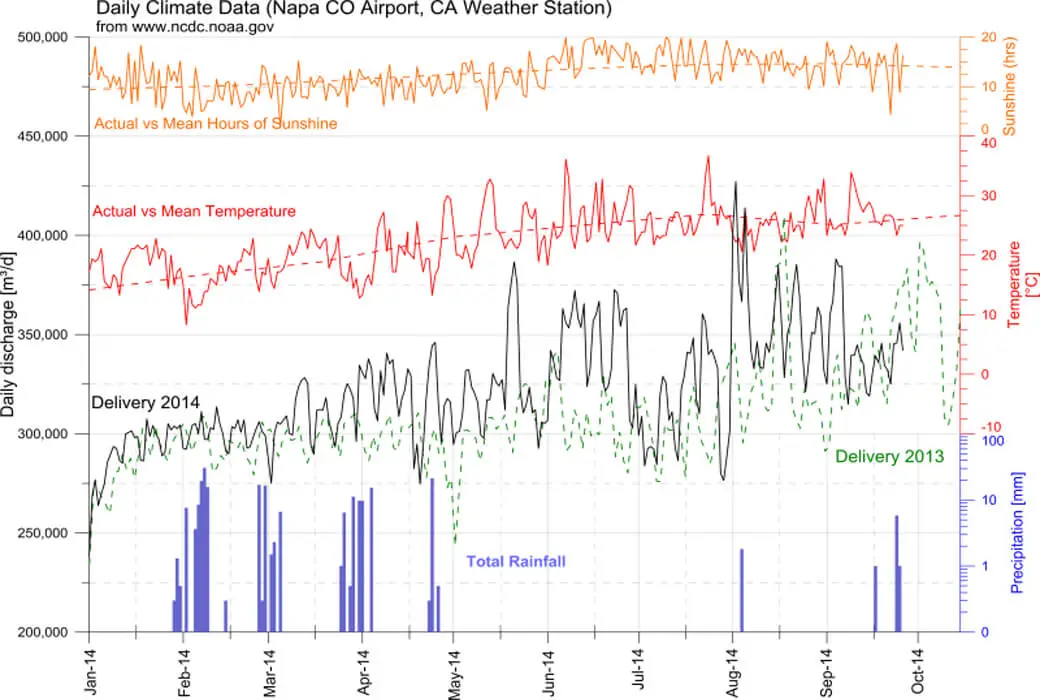
Integrated analysis tools
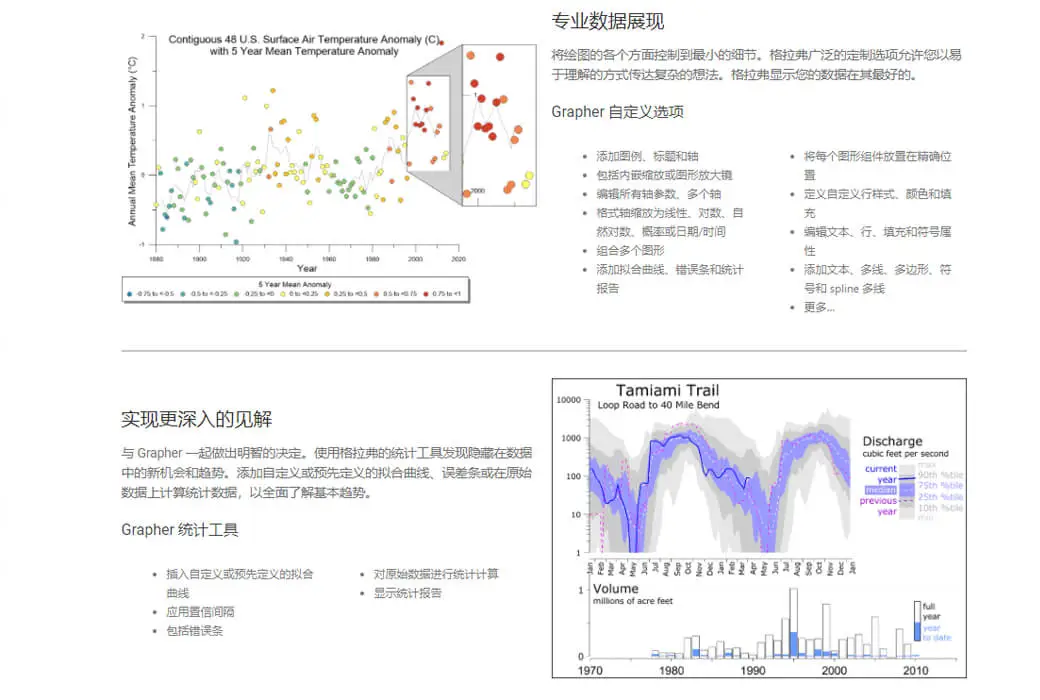
Make wise decisions by discovering trends and opportunities hidden in data. Apply custom or predefined fitting curves, error lines, or calculated statistical data to the raw data for a comprehensive understanding.
Clearly communicate the results to all audiences
Your professional knowledge is priceless, but the real test lies in conveying your results. Grapher bridges the gap between data and decision-makers, allowing you to showcase your findings in a way that resonates with both technical and non-technical audiences.
Automatically execute tedious workflows to maximize your influence
Data visualization often involves tedious processes that even the most experienced professionals can encounter. Grapher provides you with cutting-edge tools to simplify the tedious aspects of data visualization, allowing you to focus on more complex, creative, and impactful work.
Transform raw data into captivating visual effects with just a few clicks. Easily browse Grapher's user interface, generate reusable templates, and customize the user interface or default settings for maximum efficiency.
Eliminate human errors and time-consuming clicks. Use the built-in script logger or write your own scripts to automate repetitive tasks, freeing up valuable time to focus on more impactful work.
Use the graphic wizard to ensure adherence to best practices at every stage of the drawing creation process. This guide provides guidance for beginners and users, ensuring that the final plot is both accurate and elegant.
Determine the most suitable drawing type for the data, or explore new methods for representing data using graph libraries. This visualization directory displays all possible types of graphs that Grapher can implement.
Official website:https://www.goldensoftware.com/products/grapher/
Download Center:https://grapher.apsgo.cn
Backup Download:N/A
Delivery time:24-hour automatic shipping
Operating platform:Windows
Interface language:Supports English interface.
Update instructions:The first purchase of the lifetime version includes a one-year free update service. Used and updated during the subscription period of the subscription version.
Pre purchase trial:Free version with limited functionality before purchase.
How to receive the goods:After purchase, the activation information will be sent to the email address at the time of placing the order, and the corresponding product activation code can be viewed in the personal center, My Orders.
Number of devices:Can install 2 computers.
Replacing the computer:Uninstall the original computer and activate the new computer.
Activation guidance:To be added.
Special instructions:To be added.
reference material:https://www.goldensoftware.com/products/grapher/

Any question